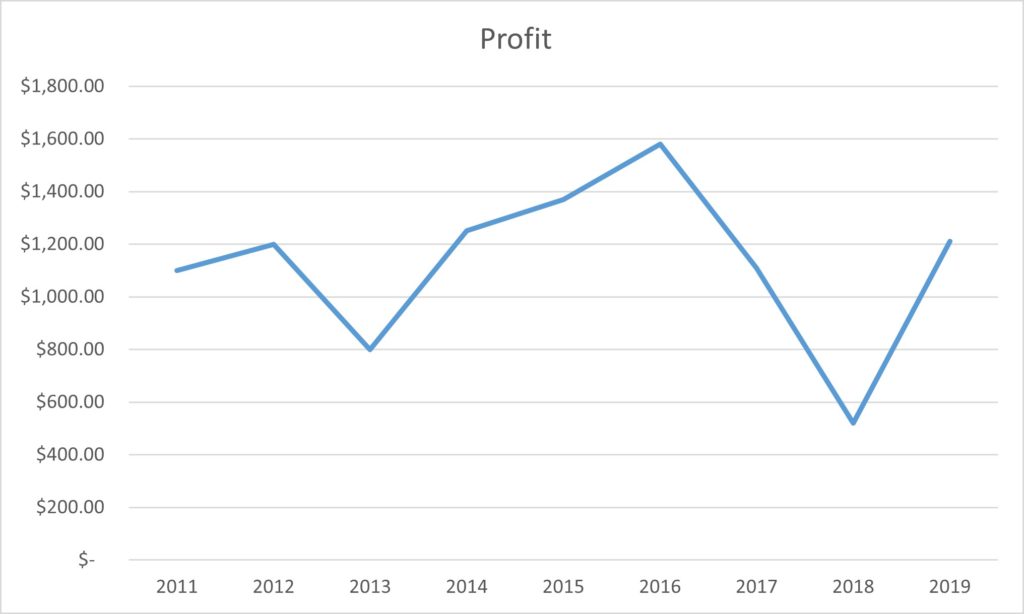
How to make a Line Chart in Excel ?
Following are some steps to make a line chart in excel. Use can also use this method to make some other charts.

- Select the data that you want to plot in the line chart.
- Click the Insert tab, and then click Insert Line or Area Chart.
- Click Line with Markers.


